
Sponsored Link
Cacti Features
If you want to know more about cacti check here
Install cacti in Ubuntu 9.10 (Karmic) Server
Preparing Your system
First you need to make sure you have install Ubuntu 9.10 LAMP server and then you need to install the following packages
sudo apt-get install php5 php5-gd php5-mysql
Install accti using the following command
sudo apt-get install cacti-spine
This will start installing cacti and prompt for some questions.
Configuring libphp-adodb option select ok Enter to Continue.

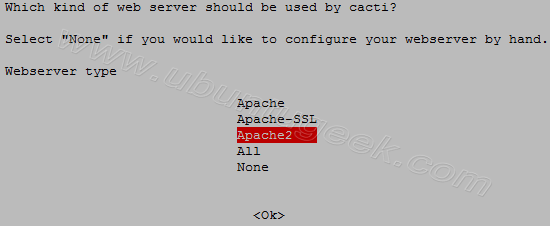
Select your webserver in this example we are using apache2 select ok Enter to Continue
Configure database for cacti select yes Enter to Continue

Enter the root password for your mysql server select ok Enter to Continue
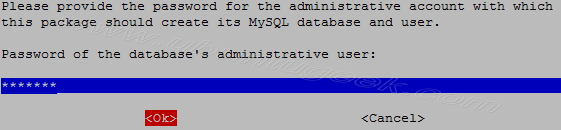
Enter the password (cacti) for the cacti database,select ok Enter to Continue

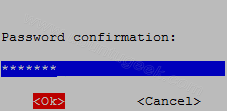
Re-enter your password
This will complete the cacti installation.
Configuring Cacti
Now you need to point your browser http://serverip/cacti press enter.You should see similar to the following screen Click Next to Continue.

You need to select the type of installation as New Installation and click next to Continue.

Now it will check all the required paths are correct or not you can see this in the following screen here click
on Finish

Now you should see the Cacti Login screen as follows

Here you need to enter username and password as admin/admin and click login

First time it will prompt you to change cacti admin user password for security reasons and click save

You should see the following screen like below once you logged.
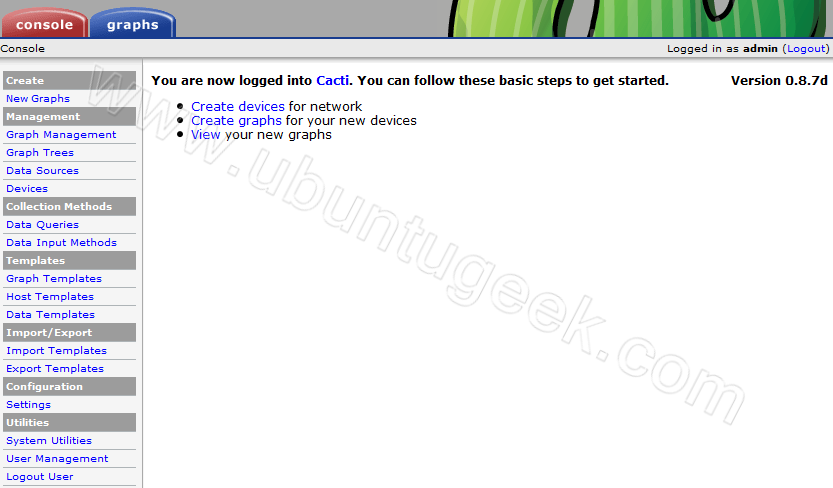
In the above screen Under Configuration Click settings on your right hand side click on paths.Make sure in the “Spine Poller File Path”, you have
“/usr/sbin/spine”

Now you need to click on Poller Select “spine” in the “Poller Type”,click on Save.

Now you need to wait for 15 min to see your server graphs starts appearing in cacti graphs.Now your Cacti Monitoring Server is Ready and if you want to know how use cacti graphs and templates check here
If you want complete list of cacti templates check here
this is why i use vnstat sooo much quicker to install and VERY light 🙂
Cacti is more advanced one compared to vnstat if you have one or two servers that is fine but if you have 20 or 30 servers this is very useful
very true but most people won’t have 20-30 servers and will just want to know how much bandwidth they use so vnstat is perfect 🙂
Does somebody have an idea that I can attach that cacti to my nagios interface?
Thanks in advance for every advice
I would like just to give a “clarafication” that I tried to go through the following tutorials :
http://blog.nicolargo.com/2008/06/lier-cacti-et-nagios.html
http://blog.nicolargo.com/2007/03/cacti-le-complement-ideal-de-nagios.html
and yours : http://www.ubuntugeek.com/install-and-configure-cacti-monitoring-tool-in-ubuntu-9-10-karmic-server.html
I’m trying to find sth in comon between these two tutoras – the last two links.
My stupid dummy question is that : What’s the differences by doing apt-get install cacti and cacti-spine?
@naanoo
Spine is a very fast poller engine, written in C. It is an optional replacement for cmd.php.
Thanks for your quick response, but have you got any idea concerning my first question?
Yeah i installed cacti-spine as told from your tuto/blog. I realise that if I want to get a host’s graphes (server/switch/router, etc) I need to do it by hand for each host whereas I have already some configurations from my nagios’s configuration file. :=) So I’m wondering how i can intergrate a small icon as showing in the first link (“hack cactiplugin”)so that we won’t tire ourselves into rewrite/”reconfigure” things all over again.
I’d like to thank you again for your feedback.
can i use nginx for cacti monitoring ?
I use parsed output of vnstat -tr -i [adapter] and have that piped into cacti/rrd so I can get the exact graphs I want. I don’t care for the stock cacti graphs all that much.
If you really want cacti to be useful you need to make sure that all of the snmp clients are setup with complete read access to all oids and you need to know that they contain. Then you can make some pretty usefull graphs.
Its helpful to have two different methods to feed info into cacti so you know your graphs are correct.
Thank you for this documentation, I was able to install Cacti on Ubuntu server successfully.
Next I would like to install Cacti plugins (Discovery, Monitor & Syslog) but do not know how to go about doing it, do you have document that help me?
Thanks very much!
Thanks for your nice instructions 🙂 it works
Hi there
Thanks for this awesome how-to. I have one problem i hope you can help me with:
My installation has been working for weeks and now i just get a blank page when i browse to “http://server-ip/cacti”. I can see it getting to the page, but no login anything appears.
try to type http://localhost/cacti
Hi, i got this error after installing a new device on cacti:
RRDTool Says:
ERROR: opening ‘/var/lib/cacti/rra/mahadhika_traffic_in_77.rrd’: No such file or directory
Any help would appreciate, thanks
hi,
I followed the installation steps successfully, but in the step of configuration cacti, when I enter my server ip at my brower, this error appears
*****************
Network Timeout
The server at 192.168.141.148 is taking too long to respond.
The requested site did not respond to a connection request and the browser has stopped waiting for a reply.
*************
what should I do?