
Sponsored Link
Bandwidth represents the capacity of the connection. The greater the capacity, the more likely that greater performance will follow, though overall performance also depends on other factors, such as latency.
Here is the list of bandwidth monitoring tools for your network bandwidth
bmon
bwbar
bwm
bwm-ng
iftop
iperf
ipfm
speedometer
cbm
ibmonitor
pktstat
mactrack
MRTG
Cacti
Now we will see each tool separately
bmon
bmon is a portable bandwidth monitor and rate estimator running on various operating systems. It supports various input methods for different architectures.
Various output modes exist including an interactive curses interface, lightweight HTML output but also formatable ASCII output
Current Stable Version :- 2.1.0
Install bmon in Ubuntu
sudo apt-get install bmon
This will complete the installation.
If you want to open the application you need to enter the following command
bmon
you should see the following output

If i select the eth0 i should see all the traffic details

If you want to know more available options check man page
bwbar
This program will output a PNG and a text file that can be used in scripts or be included in web pages to show current bandwidth usage. The amount of total bandwidth can be customized. The PNG output appears as a bar graph showing maximum possible usage with the current inbound or outbound usage shown as a differently colored bar.
Current Stable Version :- 1.2.3
Install bwbar in ubuntu
sudo apt-get install bwbar
This will complete the installation
There is a /etc/default/bwbar file to configure before this package will work and here is my config
# Directory to put files into
DIR=/var/www
# Who to run as
RUNAS=www-data
# What are the options (eth0, scale of 1.5mbps)
OPTIONS="eth0 1.5″
Now you need to chnage the permissions using the following command
sudo chown -R www-data:www-data /var/www/bwbar/
Start the bwbar using the following command
sudo /etc/init.d/bwbar start
You can also launch bwbar using the following command
bwbar eth0 100 -x 200 -y 7 -t 10 -p network.png -f network.txt -d /var/www/bwbar &
Now you need to go to http://serverip/bwbar you should see the bandwidth bar as follows

If you want to know about available option check man page
bwm
BandWidth Monitor This is a very tiny bandwidth monitor (not X11). Can monitor up to 16 interfaces in the in the same time, and shows totals too.
Current Stable Version :- 1.1.0
Install bwm ubuntu
sudo apt-get install bwm
This will complete the installation now
If you want to run the application use the following command
bwm
Output looks like below

If you want more details and available options check man page
bwm-ng
small and simple console-based bandwidth monitor.Bandwidth Monitor NG is a small and simple console-based live bandwidth monitor.
Current Stable Version :- 0.5
features
supports /proc/net/dev, netstat, getifaddr, sysctl, kstat and libstatgrab
unlimited number of interfaces supported
interfaces are added or removed dynamically from list
white-/blacklist of interfaces
output of KB/s, Kb/s, packets, errors, average, max and total sum
output in curses, plain console, CSV or HTML
configfile
Install bwm-ng in ubuntu
sudo apt-get install bwm-ng
This will complete the installation
If you want to run the application you need to use the following command
bwm-ng
Output looks like below

If you want more details and available options check man page
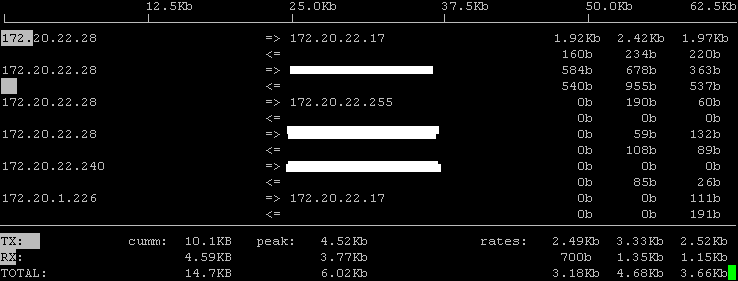
iftop
iftop does for network usage what top does for CPU usage. It listens to network traffic on a named interface and displays a table of current bandwidth usage by pairs of hosts.
Current Stable Version :- 0.17
Install iftop in ubuntu
sudo apt-get install iftop
This will complete the installation
If you want to run the application you need to use the following command
iftop
Output looks like below
If you want more details and available options check man page
ipfm
IP Flow Meter (IPFM) is a bandwidth analysis tool, that measures how much bandwidth specified hosts use on their Internet link.
Current Stable Version :- 0.11.5
Install ipfm in Ubuntu
sudo apt-get install ipfm
This will complete the installation
Now if you want to configure this for your network you need to copy example configuration file from /usr/share/doc/ipfm/examples if you want to check this file click here
once you configure this file you need to start the service using the following command
sudo /etc/init.d/ipfm start
If you want more details and available options check man page
Speedometer
Measure and display the rate of data across a network connection or data being stored in a file.
Current Stable Version :- 2.4
Install speedometer in ubuntu
Check which version of python is the default by running
python -V
Then issue the following commands as root to install speedometer (choose the correct Urwid package for your python version, ie. if python -V reports version 2.3.X then install python2.3-urwid)
apt-get install python2.4-urwid
Download the speedometer.py source file.
As user issue the following commands in the directory that you downloaded the source file
sudo cp speedometer.py /usr/local/bin/speedometer
sudo chown root: /usr/local/bin/speedometer
sudo chmod 755 /usr/local/bin/speedometer
Now you can run the speedometer application using the following
/usr/local/bin/speedometer
Now you should see the following screen output

Speedometer Usage
Usage: speedometer [options] tap [[-c] tap]
Available options
speedometer -h
Usage: speedometer [options] tap [[-c] tap]...
Monitor network traffic or speed/progress of a file transfer. At least one tap must be entered. -c starts a new column, otherwise taps are piled vertically.
Taps:
[-f] filename [size] display download speed [with progress bar]
-f must be used if directly following another
file tap without an expected size specified
-rx network-interface display bytes received on network-interface
-tx network-interface display bytes transmitted on network-interface
Options:
-i interval-in-seconds eg. "5" or "0.25" default: "1"
-p use plain-text display (one tap only)
-b use old blocky display instead of smoothed display even when UTF-8 encoding is detected
-z report zero size on files that don't exist instead of waiting for them to be created
Usage Examples
How long it will take for my 38MB transfer to finish?
speedometer favorite_episode.rm $((38*1024*1024))
How quickly is another transfer going?
speedometer dl/big.avi
How fast is this LAN?
$ cat /dev/zero | nc -l -p 12345
$ nc host-a 12345 > /dev/null
$ speedometer -rx eth0
How fast is the upstream on this ADSL line?
speedometer -tx ppp0
How fast can I write data to my filesystem? (with at least 1GB free)
dd bs=1000000 count=1000 if=/dev/zero of=big_nothing &
speedometer big_nothing
cbm
cbm — the Color Bandwidth Meter — displays the current traffic on all network devices.
Current Stable Version :- 0.1-1
Install cbm in ubuntu
First you need to download the .deb package from here
once you have the .deb package you need to install using the following comamnd
sudo dpkg -i cbm_0.1-1_i386.deb
this will complete the installation now if you want to use the appltcation use the following command
cbm
Output looks like below

pktstat
pktstat listens to the network and shows the bandwidth being consumed by packets of various kinds in realtime. It understands some protocols (including FTP,HTTP, and X11) and adds a descriptive name next to the entry (e.g., ‘RETR cd8.iso', ‘GET http://slashdot.org/' or ‘xclock -fg blue').
Current Stable Version :- 1.8.3
Install pktstat in Ubuntu
First you need to download .rpm package from here once you have the .rpm package you need to convert this .rpm file to .deb file using alien
Install alien
sudo apt-get install alien
Now you need to use the follwoing command to convert .rpm to .deb
sudo alien -k pktstat-1.7.2q-0.i386.rpm
Now you should be having pktstat_1.7.2q-0_i386.deb package
Install pktstat in Ubuntu
sudo dpkg -i pktstat_1.7.2q-0_i386.deb
This will complete the installation now you can open the application using the following command
pktstat
output looks like below

If you want more available options for pktstat check man page
ibmonitor
ibmonitor is an interactive linux console application which shows bandwidth consumed and total data transferred on all interfaces.
Current Stable Version :- 1.4
Its main features are:
Shows received, transmitted and total bandwidth of each interface
Calculates and displays the combined value of all interfaces
Displays total data transferred per interface in KB/MB/GB
Values can be displayed in Kbits/sec(Kbps) and/or KBytes/sec(KBps)
Can show maximum bandwidth consumed on each interface since start of utility
Can show average bandwidth consumption on each interface since start of utility
The output with all features (max, avg and display in Kbps and KBps) easily fits on a 80×24 console or xterm
Can interactively change its output display format depending on key pressed by user.
Install ibmonitor in Ubuntu
First you need to download the latest version from here
wget http://ovh.dl.sourceforge.net/sourceforge/ibmonitor/ibmonitor-1.4.tar.gz
Now you have ibmonitor-1.4.tar.gz
Extract this file using the following commands
tar xvfz ibmonitor-1.4.tar.gz
cd ibmonitor
If you want to run the application use the following command
Once you are in ibmonitor folder use
./ibmonitor
Output looks like the following screen

iperf
While tools to measure network performance, such as ttcp, exist, most are very old and have confusing options. Iperf was developed as a modern alternative for measuring TCP and UDP bandwidth performance.
Iperf is a tool to measure maximum TCP bandwidth, allowing the tuning of various parameters and UDP characteristics. Iperf reports bandwidth, delay jitter, datagram loss.
Current Stable Version :- 2.0.2
Install iperf in ubuntu
sudo apt-get install iperf
iperf Syntax
iperf [-s|-c host] [options]
Example
iperf -c server address -F file-name
iperf -c server address -I
The -F option is for file input.
The -I option is for input from stdin.
If you want more details and available options check man page
tcptrack
tcptrack is a sniffer which displays information about TCP connections it sees on a network interface. It passively watches for connections on the network interface, keeps track of their state and displays a list of connections in a manner similar to the unix ‘top' command. It displays source and destination addresses and ports, connection state, idle time, and bandwidth usage.
Current Stable Version :- 1.1.5
Install tcptrack in Ubuntu
sudo apt-get install tcptrack
this will complete the installation
tcptrack Syntax
tcptrack [-dfhvp] [-r ] -i []
Examples
tcptrack requires only one parameter to run: the -i flag followed by an interface name that you want tcptrack to monitor. This is the most basic way to run tcptrack
tcptrack -i eth0
tcptrack can also take a pcap filter expression as an argument. The format of this filter expression is the same as that of tcpdump and other
libpcap-based sniffers. The following example will only show connections from host 10.45.165.2
tcptrack -i eth0 src or dst 10.45.165.2
The next example will only show web traffic (ie, traffic on port 80)
tcptrack -i eth0 port 80
The following output screen will show you more details

MRTG
The Multi Router Traffic Grapher or just simply MRTG is free software for monitoring the traffic load on network links. It allows the user to see traffic load on a network over time in graphical form.
Current Stable Version :- 2.15.0
Project Homepage
Cacti
Cacti is a complete network graphing solution designed to harness the power of RRDTool's data storage and graphing functionality. Cacti provides a fast poller, advanced graph templating, multiple data acquisition methods, and user management features out of the box. All of this is wrapped in an intuitive,easy to use interface that makes sense for LAN-sized installations up to complex networks with hundreds of devices.
Current Stable Version :- 0.8.6i
Project Homepage
Regarding MRTG and Cacti i am going write detailed articles in future
aren’t there any nice Gnome GUI graphical versions of these tools?
Don’t forget jnettop.
You may want to add dstat and ifstat to your list of bandwidth monitoring tools. (Shameless plug since I wrote dstat)
With dstat you can monitor lots of different hardware and software counters and you can add your own plugins to show your own counters.
Output is in color. Here is an example showing time, cpu and network counters.
[dag@rhun ~]# dstat -tcnf 5
—–time—– ——-cpu0-usage—— –net/eth1-
date/time |usr sys idl wai hiq siq| recv send
21-12 18:58:59| 19 3 70 8 1 0| 0 0
21-12 18:59:04| 1 0 99 0 0 0| 61B 51B
21-12 18:59:09| 8 1 91 0 0 0| 99B 40B
ifstat is similar in output, here’s what you’ll get.
[dag@rhun ~]# ifstat -i eth1 5
eth1
KB/s in KB/s out
0.04 0.03
0.03 0.04
0.03 0.03
0.09 0.05
Both tools have some interesting options to make the output more useful.
iptraf is another curses tool that is fairly useful as well.
For an easy to install application which publishes (per ip) web graphs see bandwidthd.
nload is another simple and effective monitor with a few configuration options.
Some may want to measure bandwidth rather than monitoring. We use iperf.
http://dast.nlanr.net/Projects/Iperf/
Are any of these tools able to distinguish traffic on multiple virtual ip addresses sharing one ethernet interface? (eth0, eth0:1, eth0:2, etc)
Do not forget ntop. It’s really a great tool.
But otherwise the wide selection of CLI tools you present is impressive.
Nice article. And don’t forget these work on all Linuxes, not just Ubuntu.
For a good network monitoring applet for gnome, have a look at netspeed:
http://www.wh-hms.uni-ulm.de/~mfcn/netspeed/
It has a great interface and is superior to netmon-applet (http://www.demonseed.net/~jp/code/netmon_applet/) as it can display a graph of previous usage and has an option to “always display a connected device” which will automatically switch to your connected device if it changes.
When you look at MRTG and Cacti in detail I would love to read how Munin compares to them.
Yes, don’t forget jnettop. I’ve tried all the others and jnettop is the one I find most useful. It shows you how much bandwidth each IP connection is using, you can aggregate to see how much of what types of traffic or what host is using the most. Sort by RX or TX, and use tcpdump filters.
The venerable (but still actively maintained) GNOME Krell Monitor (a.k.a. gkrellm) provides per-interface and per-service network usage graphs in real time. It remains a standard install for me on almost all of my machines, especially now it has a client-server architecture so you can monitor multiple machines simultaneously.
gdesklets eye candy includes a number of beautiful little graphical representations of current bandwidth usage as well as total throughput. These are usually configurable on a per network device basis.
My preferred one is the SideCandy network monitor for gdesklets.
Automatix can install gdesklets too, so it’s very easy for new users to get up and running.
And for in-depth monitoring, graphs, dashboards, thresholds, … even capacity planning, see http://moodss.sourceforge.net/
I can’t believe you haven’t mentioned iptraf.
Please apt-get install it and take a look – it’s a beautiful ncurses bandwidth monitor.
A tool for displaying daily and monthly bandwidth:
apt-get install vnstat
I’m surprised no-one’s mentioned pload. It’s the best bandwidth monitoring tool
I’ve come across. Although the man page says it’s for measuring ppp throughput,
it works with any network interface.
There’s also Hendrik Scholz’ slurm, for those who need some console graphics. It’s in FreeBSD ports and Debian…
Here’s my favourite for a snapshot of heavy downloaders…
potion – IP Flow Monitor
apt-get install potion
I have searched around for a while and can’t find what I am looking for.
And I realise that I’m probably not at all welcome here due to the fact that I am a Windows user.
If anyone is familiar with was I need it would be greatly appreciated.
I’m currently running netlimiter pro on all of my computers at home which are all connected to the internet through a Netgear Wireless router (WGR614)
I am very happy with the netlimiter program but what I want to be able to do is monitor how much bandwidth usage each computer (or device in the instance of my Nintedo DS and Nintendo Wii) is using and if possible to be able to monitor how much each program or process on each individual computer and be able to monitor it all on one program running on my main computer.
Pretty much an extensive version of Netlimiter.
Thank-you in advance for any help you can provide.
Same as Zygron here…..I’d like to monitor bandwidth usage for device and for EACH running process/task. A tool to monitor and assign a specified network bandwidth for each task does not exist in the beautiful unix world :(, does it?
I’ll take a look at all the program mentioned before…..but already did a search a few months ago, and came up with nothing 🙁
Any help appreciated!
In response to Tony’s slander about gkrellm :). The G in Gkrellm does not stand for GNOME – it stands for Gtk or GNU (as stated in the FAQ at the gkrellm site) (and you can see the logo has the words Gtk Monitors under it).
Gtk != GNOME
Gtk = good, GNOME = rubbish
Anybody should be able to tell that gkrellm is not a GNOME application though, as it actually is configurable and is able to do handy stuff that people with a brain might want it to do. Any GNOME version of gkrellm would have long since had all features removed in favour of not confusing the ‘users’.
Sorry to go a bit off-topic there.
Gnome panel has a “System Monitor” applet that displays processor load
Right-click on the graph, and you can also add more graphs – including to display a rolling graph of your Network usage – very pretty and good for judging how much of your bandwidth you are using 🙂
Jay.
Thanks so much for this list. You’ve helped me out greatly!
I don’t see why system monitor isn’t good enough for these tasks, just add it to the panel in ubuntu and you’ve got yourself a real-time network meter!
Hi,
I really need a tool to understand my home’s (i.e. various PCs/Xbox etc) usage of my internet allocation. I run a linux based firewall. Are there any good linux based software packages you could recommend for this? (i.e. all my traffic goes through my http://www.clarkconnect.com/ PC firewall at the moment, i.e. with 2 NIC cards). What I’m after is:
[1] Tool that summarises my family’s internet bandwidth usage (on ppp0) per internal IP address/PC, per day, per upload/download?
[2] As a bonus it would be great if the report [1] above could also be configured to break down the traffic based on hours of the day, i.e. to compare against the ISP Peak & OffPeak bandwidth limits.
Regards
Greg
@greg
i would recommend cacti which can do all you are looking for
Hi,
is there a tool which can monitor bandwidth usage per subnet ?
My connection is
user2
|
internet—>modem—>switch—>user1
I wish to see bandwidth consumed per user here. Anyway posible?
pktstat is in the Ubuntu repos now, no need for alienating it from an rpm. Just installed it today.